Skip to content
writing

The Point Estimate Is a Lie of FormatPublic

Open access · through Aug 15, 2026

This piece is free to read, for now.

After Aug 15, 2026, it moves behind club sign-in. Join now — free, no card — and keep this piece, plus everything else, after the window closes.

Precision that presents a distribution as a single measured fact isn't rigor — it's the uncertainty, deleted.

EvaluationHypothesisLast tended · 2026-07-27
Precision that presents a distribution as a single measured fact isn't rigor — it's the uncertainty, deleted.

Confidence: hypothesis. The forecasting theory below is drawn from published statistical literature on probabilistic prediction, not firsthand deployment. The reporting standard is an argument I have not shipped at scale. Argue with it.

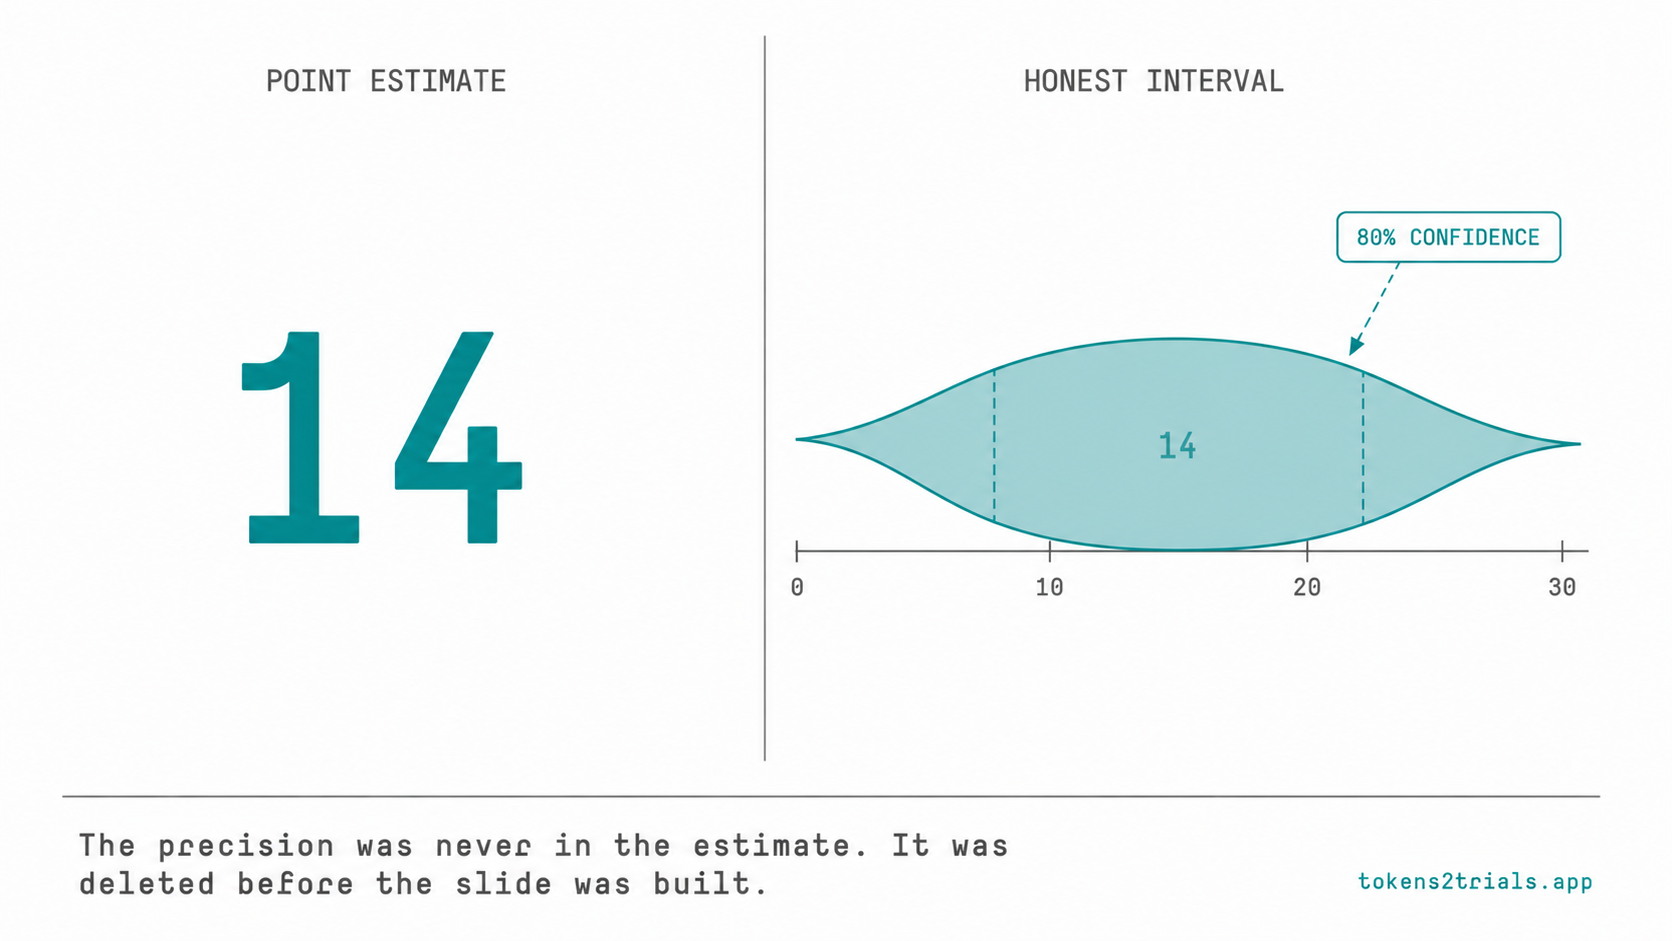
“14 patients per month.” “Ships in six weeks.” “92% likely to close.” Every one of these numbers looks precise. Almost none of them are honest, because the precision is doing work the underlying estimate never actually did — it's presenting a distribution of plausible outcomes as if it were a single measured fact.

The clinical why

A clinical trial's enrollment forecast is a genuinely uncertain quantity — a function of epidemiology, screening rates, consent rates, and competing-trial pressure, each one itself an estimate. Multiply several uncertain factors together and the honest output is a range of plausible enrollment rates, wider than anyone wants to put in a budget deck. What actually gets put in the deck, traditionally, is one number in the middle, with the uncertainty quietly deleted before the slide gets built.

That deletion isn't a rounding convenience. It's the single most consequential edit in the whole forecasting process, because it's the moment a distribution of honest possibilities becomes a promise nobody can defend when the real number lands somewhere else in that distribution — which, statistically, it usually does, since a distribution's mean is rarely its most likely single outcome in the way a bare number implies.

The same deletion happens constantly outside clinical trials. A software team's “ships in six weeks” is drawn from a distribution shaped by unknowns — dependency delays, scope creep, a key engineer's availability — that the team understood perfectly well when they built the estimate and then discarded before the number reached the roadmap slide. A sales forecast's “92% likely to close” usually started as a range across several deals with different confidence levels, compressed into one figure that reads as a measurement of something rather than a judgment call about several things.

The statistical case against the bare number

This isn't a stylistic preference for hedged language. It's the settled conclusion of decades of work on how to evaluate a forecast honestly. Statisticians Tilmann Gneiting and Adrian Raftery, in a widely cited 2007 paper formalizing the theory of proper scoring rules, made the underlying principle precise: a forecast should be evaluated on whether it reports the full predictive distribution honestly, not just whether a single derived number happened to be close.¹ A scoring rule is “proper” specifically when it rewards a forecaster for reporting their actual uncertainty rather than gaming the metric with an artificially narrow or artificially confident-looking number. Under a proper scoring rule, a forecaster who honestly reports “40–60%, wide uncertainty” scores better over time than one who confidently states “50%” and is right only by luck — because the first forecaster's stated uncertainty matched reality, and the second forecaster's certainty was never earned.

The point estimate fails this test structurally, not occasionally. It has nowhere to encode the forecaster's own confidence, so it always presents as maximally confident regardless of how uncertain the underlying estimate actually was. A single number can't be more or less honest about its own uncertainty — that information is deleted at the point the range collapses into one digit.

Gneiting and Raftery's framework also supplies the tool for catching a forecaster gaming the system in the other direction — reporting an interval so wide it can never be wrong. Properness means the best possible score goes to the forecaster who reports their true, honestly-held distribution, not to whoever hedges hardest. A forecaster who always says “somewhere between almost nothing and almost everything” scores worse under a proper rule than one who commits to a narrower, genuinely-held range and is sometimes wrong — because properness rewards calibrated precision, not the mere avoidance of being provably incorrect.

What an honest forecast looks like instead

Three things distinguish a properly-scored forecast from a bare number wearing a forecast's clothes:

1. It reports an interval with a stated confidence level. “10–18 patients per month, 80% confidence” carries the information a point estimate destroys: how wide the honest range of outcomes actually is, and how sure the forecaster is willing to claim to be.

2. The interval is checked against reality, not just stated. An interval that's never compared to what actually happened is unfalsifiable in exactly the way a bare number is — calibration means tracking whether your 80% intervals actually contain the truth roughly 80% of the time, over enough forecasts to tell. One interval proves nothing either way; the pattern only emerges across a run of them, which is exactly why the record has to be kept in the first place rather than reconstructed from memory after the fact.

3. Narrower intervals cost more to earn, and that cost is visible. A forecaster (human or model) should not be free to claim a narrow, confident interval without a track record that justifies that confidence. Rewarding narrow intervals regardless of whether they're subsequently right just re-creates the point-estimate problem one level up.

Where AI changes the shape of this: a model can generate and maintain a full predictive distribution — and update it continuously as new data arrives — far more cheaply than a human forecaster reruns a spreadsheet by hand. That's a real capability gain. It does not, on its own, fix the reporting problem: a model just as easily collapses its own distribution into one confident-looking number if nothing downstream insists on the interval, and a model asked to summarize its own forecast for a slide will often do exactly what a time-pressured human analyst does — round the distribution down to its headline number because that's what the slide template has room for. The discipline has to be enforced at the reporting layer, not assumed to follow from better modeling underneath it.

What to measure first

Find one forecast your team currently reports as a bare number and ask where its interval went. If nobody can reconstruct the range the point estimate was drawn from, the number was never actually a forecast in the proper-scoring sense — it was a single sample from an uncertainty nobody wrote down, presented as if it were the whole story. Count how many of your team's reported numbers survive that question versus how many turn out to have no reconstructable range behind them at all; that ratio is a more honest measure of your forecasting maturity than any single number's apparent precision.

Where this breaks in practice: an interval that's wide enough to always be technically correct (“somewhere between 2 and 200 patients a month”) is as useless as a false point estimate — properness rewards calibrated confidence, not maximal hedging. The discipline is in matching the stated interval's width to the forecaster's actual, checkable track record, not in avoiding commitment altogether.

References

  1. Gneiting, T. & Raftery, A.E., “Strictly Proper Scoring Rules, Prediction, and Estimation”, Journal of the American Statistical Association 102(477) (2007) — the formal theory of scoring rules that reward forecasters for honestly reporting their predictive distribution rather than an artificially confident point estimate.

This pattern is one piece of a longer treatment. The full essay is issue 3 of Stage × AI, a series walking the entire clinical-trial lifecycle stage by stage — what each stage really does, where AI helps, where it must not go, and one buildable pattern per stage:

full essay
Feasibility: The Forecast Everyone Wants to Believe

Evidence in, evidence out. Corrections welcome.