Skip to content
writing

Don't Blend Your Forecast Sources — Score Them SeparatelyPublic

Open access · through Aug 15, 2026

This piece is free to read, for now.

After Aug 15, 2026, it moves behind club sign-in. Join now — free, no card — and keep this piece, plus everything else, after the window closes.

Averaging three forecasts into one number destroys the one thing worth knowing: which source to trust.
EvaluationData EngineeringHypothesisLast tended · 2026-07-27
Averaging three forecasts into one number destroys the one thing worth knowing: which source to trust.

Confidence: hypothesis. The calibration-tracking research below is drawn from published forecasting-tournament literature, not firsthand deployment. The source-scoring discipline is an argument I have not shipped at scale. Argue with it.

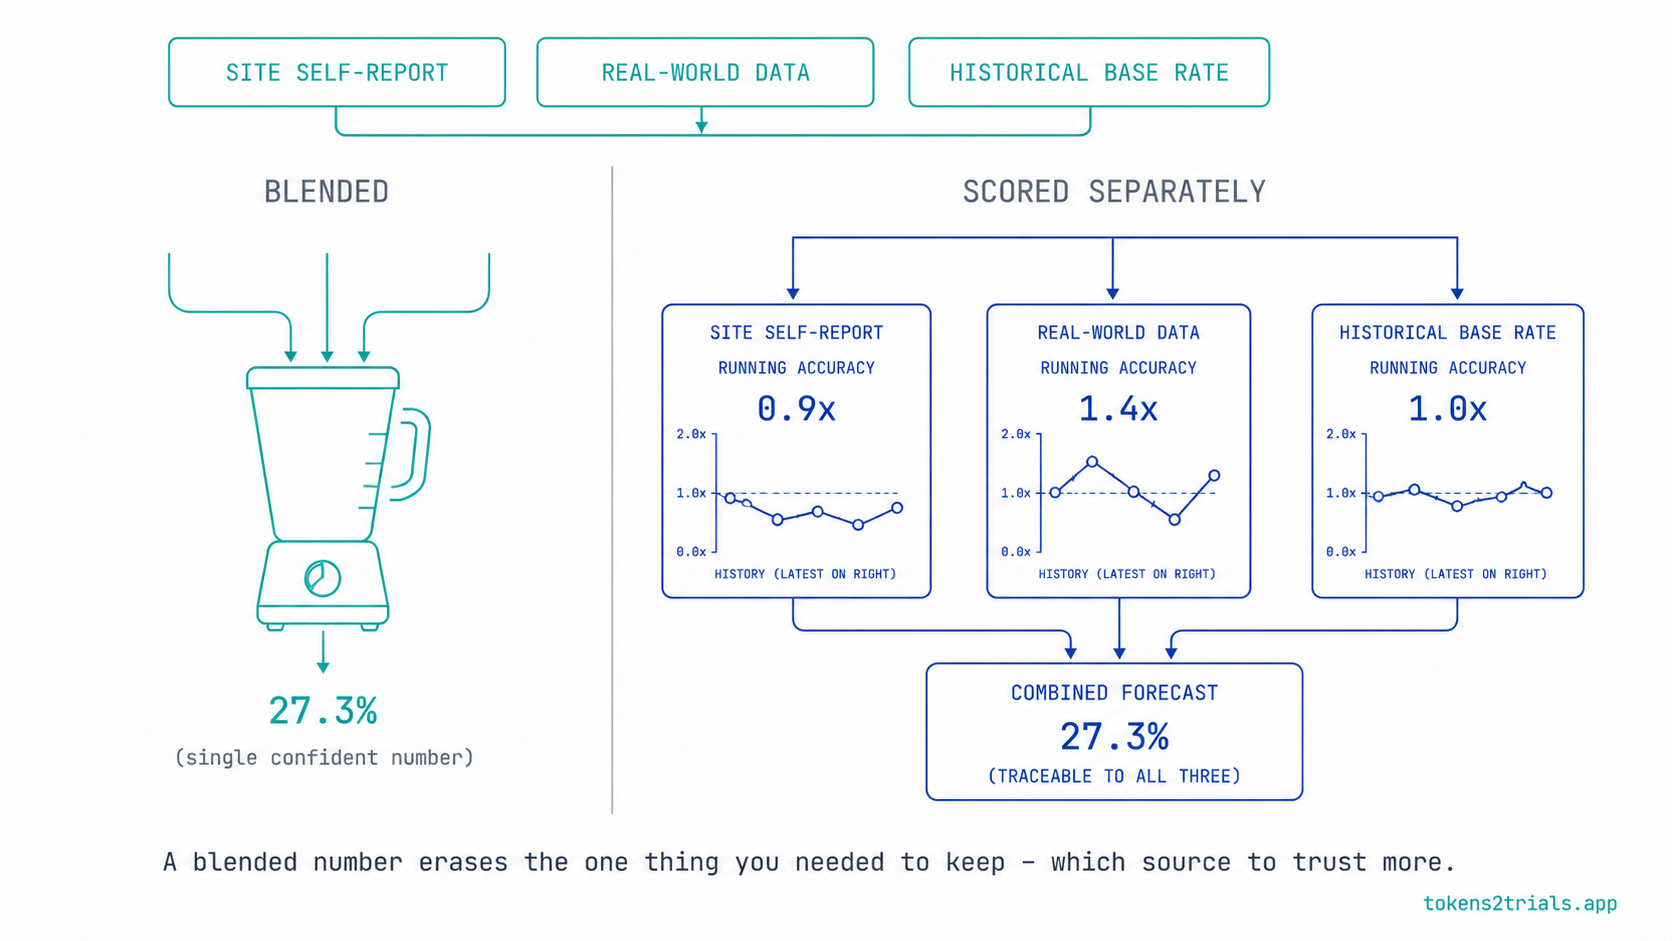
Most forecasting pipelines have more than one source feeding the final number — a site's self-reported capacity, a real-world-data count, a historical base rate, a vendor estimate, a model's own prediction. And most pipelines do the same thing with all of them: average them into one number and report that. The average feels rigorous. It's actually where the signal goes to die.

The clinical why

A clinical trial's enrollment forecast is built from exactly this kind of blend: what a site says it can enroll, what real-world data says the eligible population actually looks like, and what similar trials historically achieved per site per month. Each of these sources has a wildly different, well-documented failure mode. Site self-reports run optimistic — a coordinator recalls a handful of patients who might qualify and projects that recollection into a monthly commitment. Real-world-data counts are only as good as the criteria translated into a query. Historical base rates assume the new trial resembles the old ones closely enough to transfer.

Blend those three into one number and you get a forecast with no discoverable failure mode — when it misses, you can't tell which input broke, because the blending step destroyed the information about which source said what. You're left re-litigating the whole forecast from scratch instead of fixing the one input that was actually wrong.

Here's the concrete version. A site says it can enroll 20 patients a month. A real-world-data query against the region's claims data says the eligible population supports about 6. A simple average reports 13 — a number neither source actually believes, confident-sounding precisely because it's arithmetic rather than judgment. When the trial enrolls at 7 a month, the postmortem has nothing to work with: was the site's number too high, was the RWD query too conservative, or did the blend itself introduce the error? Nobody can say, because the blend erased the two original claims the moment it produced the average.

The pattern: score the source, not just the number

Forecasting-tournament research has spent over a decade demonstrating that individual-level tracking beats blended aggregates for exactly this reason. The IARPA-funded Good Judgment Project — a multi-year forecasting tournament run by Philip Tetlock and colleagues — didn't just collect predictions and average them. It tracked each forecaster's accuracy over time, identified the ones who consistently outperformed (the “superforecasters”), and found that individual performance was durable: roughly 70% of superforecasters retained that status from one year to the next, with a 0.65 year-over-year correlation in accuracy.¹ That durability is only visible because the project tracked forecasters separately — a blended crowd average would have shown the tournament's overall accuracy improving, but it would never have revealed which specific forecasters were worth listening to more. The tournament's own aggregation methods made this explicit: rather than treating every submitted probability equally, later rounds weighted contributions toward forecasters with better track records — the same move, formalized, that a forecast pipeline is skipping when it averages a site's self-report with a data query as if the two had earned equal trust.

The lesson generalizes past forecasting tournaments into any pipeline with more than one input feeding a decision. A model that retrieves and blends three signals without tracking which one has actually been right is doing exactly what a naive crowd-average does — trading away the one piece of information (which source to trust more) that made the tournament's later rounds outperform its earlier ones.

The generalizable move, in four parts:

1. Give every source its own forecast-versus-actual ledger. Not a combined accuracy number — a separate running history per source: this site's self-reports, this vendor's estimates, this historical-base-rate model. Each source accumulates its own track record, checkable independently of the others.

2. Score before you weight. A source's contribution to the final forecast should be a function of its own historical accuracy, not an equal share by default. A source with a strong track record earns more weight in the next forecast; a source that's been consistently 3x optimistic earns a discount, explicitly, not silently. Mechanically, this doesn't require anything exotic — a rolling ratio of actual-to-predicted over the last several cycles per source, updated as new actuals land, is enough to turn “we think the site tends to overestimate” into a specific, applyable number instead of a shared feeling nobody has actually measured.

3. Keep the disagreement visible. When sources disagree sharply — the site says 20 patients a month, the real-world-data query says 6 — that gap is the finding, not noise to be averaged away. A wide, visible spread between differently-tracked sources is more informative than a falsely confident single blended number that happens to land in the middle. In the enrollment example above, a visible 20-vs-6 spread would have prompted the obvious next question — is the site's eligibility definition looser than the RWD query's criteria, or is the RWD data missing a patient population the site can actually see — before the money committed to either number. An averaged 13 asks no such question; it just looks done.

4. Re-score on a schedule, not just at the postmortem. Individual-source accuracy should update every time real data arrives, not only when the whole forecast is graded at the end. A source's weight earned in January should already be adjusted by the time March's forecast gets built.

Where AI changes the economics here: a model can maintain per-source ledgers and recompute weights continuously in a way that was previously too much bookkeeping for a busy team to sustain by hand. That's a genuine capability gain — it doesn't change what's being tracked, just how cheaply the tracking can be kept current. A team running a dozen sites across several countries, each with its own self-report and its own RWD comparison, was never going to hand-maintain a dozen separate accuracy ledgers updated every time new data landed; a model that treats “update every source's track record” as a scheduled query rather than a quarterly analyst project is the difference between the discipline being real and the discipline being aspirational.

What to measure first

Pick one forecast your team currently blends from multiple inputs. Split the historical record by source, if you can reconstruct it, and ask: which source has actually been closest to reality over the last several cycles? If you can't answer that question because the sources were never tracked separately, that's the finding — you've been reporting a number without knowing which part of it to trust.

Where this breaks in practice: source-level tracking only works if the sources are genuinely independent — if two “separate” sources are actually both derived from the same underlying site questionnaire, tracking them separately just doubles the bookkeeping without adding real signal. And a source with too short a track record can't be meaningfully scored yet; forcing a confident weight onto a new source before it has enough history is its own kind of unearned precision.

References

  1. Tetlock, P.E. & Gardner, D., Superforecasting: The Art and Science of Prediction (2015); and the Good Judgment Project, the IARPA-sponsored forecasting tournament (2011–2015) underlying it — individual forecaster tracking, calibration measurement, and the durability of superforecaster performance across years.

This pattern is one piece of a longer treatment. The full essay is issue 3 of Stage × AI, a series walking the entire clinical-trial lifecycle stage by stage — what each stage really does, where AI helps, where it must not go, and one buildable pattern per stage:

full essay
Feasibility: The Forecast Everyone Wants to Believe

Evidence in, evidence out. Corrections welcome.